Key insights:
- FET price reaches $0.2263, matching the 200-day moving average level during daily trading sessions.
- Trading volume rises to 40.88 million as price approaches a key technical resistance zone.
- Market data shows an earlier downtrend from $0.95 in 2025 to $0.15 support level in 2026.
- Higher lows form at $0.15, $0.19, and $0.21 as price structure shifts over several weeks.
FET has moved to its 200-day moving average on the daily chart. The move follows a long downtrend that started after a peak in early 2025. Market activity has shown gradual recovery patterns since February 2026.
FET Price Moves Toward 200-day Moving Average
Fetch.ai (FET) trades near the 200-day moving average at $0.2263 on the daily chart. The level acts as a reference point for long-term price movement. Market data shows the price touching this zone during active trading.
The move follows a long decline from earlier highs near $0.95 in 2025. The token then formed a downward trend with repeated lower highs and lower lows. The 200-day moving average tracked this movement as it moved downward over time.
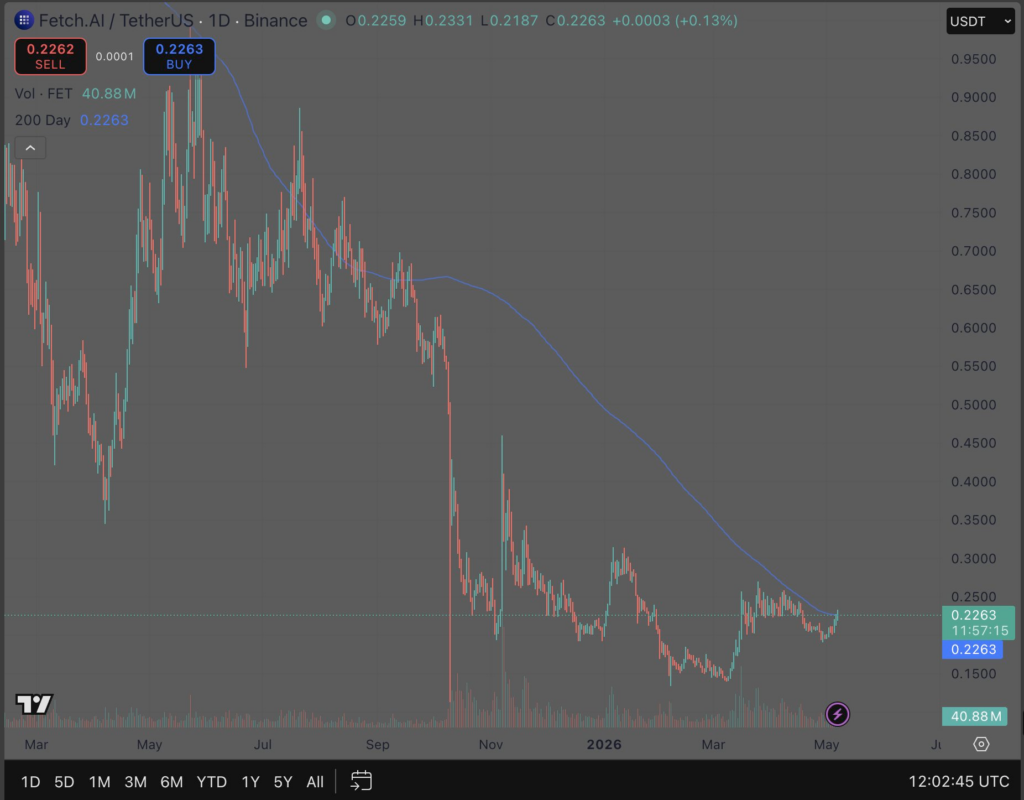
Trading volume reaches 40.88 million during the approach to the moving average. This level shows active participation during the price test. The daily chart now shows price and the moving average at the same point. A daily close above or below the level will confirm short-term direction. Market participants continue to track the interaction between price and the moving average line.
Market Structure Shows Higher Lows and Trading Activity
FET price forms a long downtrend that later slows near the $0.15 level in early 2026. This zone acts as a support area where selling pressure reduces. After this point, price begins to recover in steps. Higher lows appear at $0.15, $0.19, and $0.21 over several weeks.
These levels show gradual upward movement in price action. The structure changes as price moves away from the earlier low. The 200-day moving average still slopes downward. This reflects the extended period of decline in earlier months. However, current price action shows repeated tests of higher levels.
Market participants monitor the interaction between the trend line and price. The current level near $0.2263 remains a key zone for daily trading activity. Price movement around this area continues to shape short-term market direction.