
Key Insights:
- Bitcoin dropped below 4% quantile in Power Law regression model analysis data report.
- Rare valuation zones have appeared only in a small portion of Bitcoin history records analysis.
- Analysis suggests long term accumulation activity often increases during deep corrections market cycle phases.
- Investor positioning varies as risk tolerance and market volatility conditions change over extended periods.
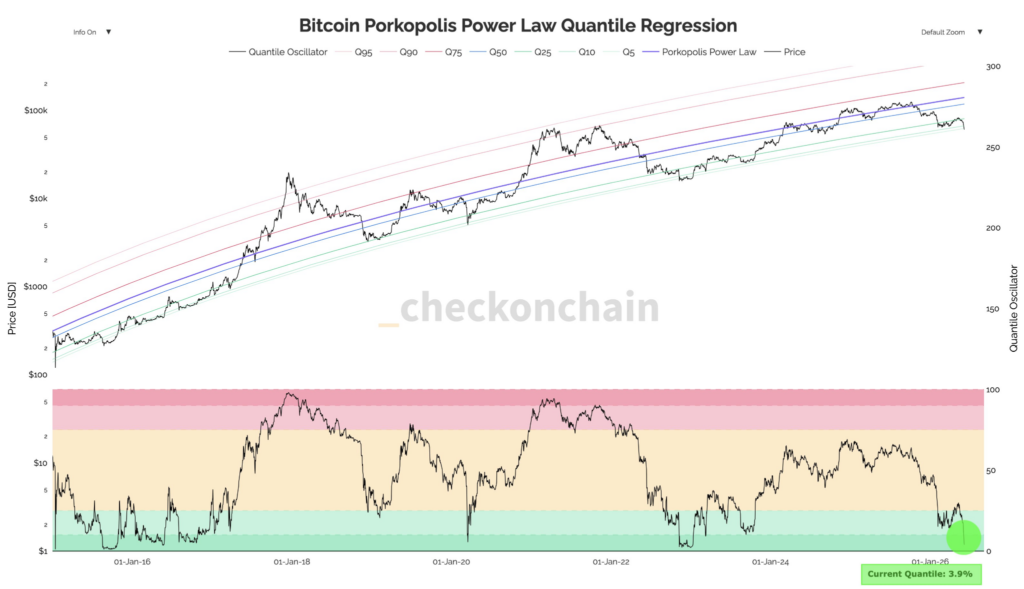
Bitcoin has recorded a decline to an extreme regression level under the Power Law model. Market data shows a deviation from long-term trend behavior. The asset moved below the 4% quantile, a range linked with rare historical pricing zones. This level places Bitcoin within a long-term valuation band compared with its growth curve. This range has been observed only in limited historical cycles. Trading activity reflects broader volatility across digital asset markets.
Bitcoin Moves Below Power Law 4% Quantile
The Power Law model is used to compare Bitcoin price behavior against a long-term growth trend. The model tracks how price moves around a projected curve. Recent data shows the token trading under the lower 4% band. This band has appeared in only a small portion of Bitcoin’s history. Price movement is measured against historical scaling behavior.
This framework is used in long-range Bitcoin cycle studies. Model behavior reflects logarithmic scaling characteristics over time. Market observers note that such levels reflect extended distance from the long-term trend line. Darkfost states that the token has spent less than 4% of its trading history at these levels.
The movement places current prices in a rare statistical area compared with past cycles. Such readings are often compared with previous bear market phases. Comparative analysis includes prior market bottoms.
Market Behavior and Investor Positioning Signals
The analysis suggests that low valuation zones often appear during strong market corrections. Data from the model shows periods of heavy price decline before recovery phases. The current Bitcoin reading is being tracked by traders who monitor long-term accumulation patterns. These phases often align with increased long-term accumulation activity.
Investor sentiment tends to vary during extended drawdowns. Market participants assess liquidity conditions during these phases. The report notes behavior patterns among investors during similar phases, and states that exposure building has historically increased during such levels.
It also adds that late participation has often followed later stages of price recovery cycles. Market timing patterns differ across investor groups. Positioning decisions are influenced by risk tolerance levels. Long-term strategies adjust based on volatility patterns.