Key insights:
- Solana trades near $86.20 with Bollinger Bands tightening between $77 and $94 on 3-day chart.
- Analysts describe current Solana range as no-trade zone due to reduced volatility and choppy movement conditions
- Solana ecosystem records $600 million stablecoin issuance led by Tether contributing $350 million activity flow data
- The token maintains active trading with $3.73 billion volume while price changes remain slightly positive session data
Solana price moves within a tight range as technical pressure builds and network activity rises. Market data shows reduced volatility on higher timeframes, while on-chain issuance activity increases. Traders watch price action closely as Bollinger Bands on the 3-day chart continue to contract.
Solana Bollinger Bands Signal Compressed Market Structure
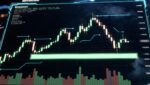
Solana continues to trade inside a narrow consolidation area as volatility decreases on the 3-day chart. The Bollinger Band squeeze shows reduced price movement and tighter trading conditions. Ali Charts stated that price action inside this zone often leads to choppy movement.
Market participants observe the $77 support and $94 resistance as key levels. The structure shows repeated rejections near both boundaries. The setup suggests that momentum remains limited until a breakout occurs above or below the defined range. The analyst referred to the range as a “no-trade zone.”
As of press time the token trades at $86.20 with a 24-hour trading volume of $3.731B. The asset records a 0.14% increase over the last day. Price movement remains stable despite reduced volatility. Market activity continues within the same consolidation zone without a strong directional shift. A clean 3-day candle close outside this range is needed for a clearer direction
Stablecoin Issuance Increases Across Solana Ecosystem Activity
Meanwhile, the token network recorded $600 million in stablecoin issuance within 24 hours. Tether accounted for $350 million of the total issuance. The data shows continued liquidity flow across the network. Stablecoin minting activity remains one of the key indicators of network usage.
Higher issuance levels often increase available liquidity for trading activity on-chain. The recent figures show sustained movement of capital within the Solana ecosystem. Trading activity remains steady as both price and network metrics show mixed signals.
Price consolidation continues while issuance data reflects active network participation. The combination of stable price movement and rising issuance keeps market attention on the token’s short-term structure.