Key insights:
- XRP consolidates within a symmetrical triangle as price approaches apex.
- ETF inflows remain steady while traders monitor $1.35 support and $1.45 resistance levels closely today markets.
- Breakout scenario suggests potential 26% move depending on daily close confirmation above or below range.
- Whale transfers to Binance surge as XRP declines to $1.39 amid rising exchange inflows.
XRP trades near $1.39 as market activity builds around a consolidation pattern. The asset moves inside a symmetrical triangle on the daily chart. Price approaches the apex as trading range tightens across sessions. Market structure remains neutral until breakout direction is confirmed.
As of price time XRP trades at $1.39 with a 24-hour trading volume above $1.7 billion. The price has increased slightly by 1.45% over the last day.
XRP Symmetrical Triangle Forms on Daily Chart
XRP continues trading within a symmetrical triangle pattern on the daily chart. The structure shows lower highs and higher lows across recent sessions. Price compression suggests reduced volatility before a breakout move, as traders observe $1.35 as support and $1.45 as resistance level. These levels define the short-term trading range for market participants.
According to Ali Charts, this structure forms as volatility reduces and price approaches the apex. This setup often appears before strong directional moves in crypto markets. Liquidity levels remain moderate across major trading pairs. Analysts measure pattern height to estimate a potential 26% move. The breakout direction remains dependent on daily close confirmation outside range.
If XRP price moves above resistance may point toward the $1.82 price level but, a close below support may direct price toward the $1 zone. Market participants avoid trades inside mid-zone due to false breakouts. Volume spikes are expected if breakout occurs.
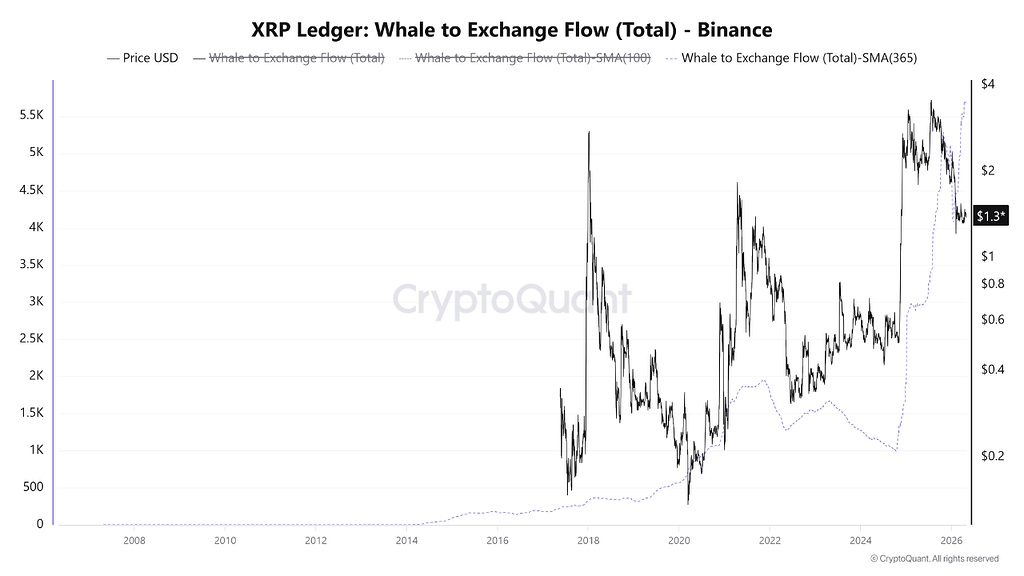
XRP Whale Exchange Inflows Hit Record Highs Again
XRP has recorded increased whale activity moving funds to exchanges, according to CryptoQuant data. During the same period, the asset price declined from 3.55 to 1.39. Analysts noted that whale transfers to Binance, measured using the 365-day simple moving average, reached record levels. The data suggests higher distribution activity from large holders into exchange wallets.
Market observers track such flows because they can indicate potential selling pressure in spot markets. The rise in exchange inflows occurs alongside heightened market volatility and shifting liquidity conditions. Traders continue to monitor whether these inflows stabilize or continue increasing over the coming sessions as price remains under pressure near current trading ranges reported.