
Key Insights:
- TAO reclaims 200-day moving average near $273, signaling shift in short-term market structure direction now.
- Price holds strong support at $232.8 Fibonacci level with repeated buying interest observed during recent sessions.
- Resistance at $288 remains critical, with traders watching weekly close for confirmation of breakout momentum.
- Rising wedge pattern forms on 4H chart, placing TAO near key decision zone for next move.
Bittensor (TAO) trades near a key technical level after reclaiming a major moving average. Market data shows price action tightening within a defined range, and traders are monitoring the next move closely.
The live price of Bittensor stands near $275, with a 24-hour trading volume above $279 million. The asset has gained over 5% within a day, according to recent data.
TAO Reclaims 200-Day Moving Average
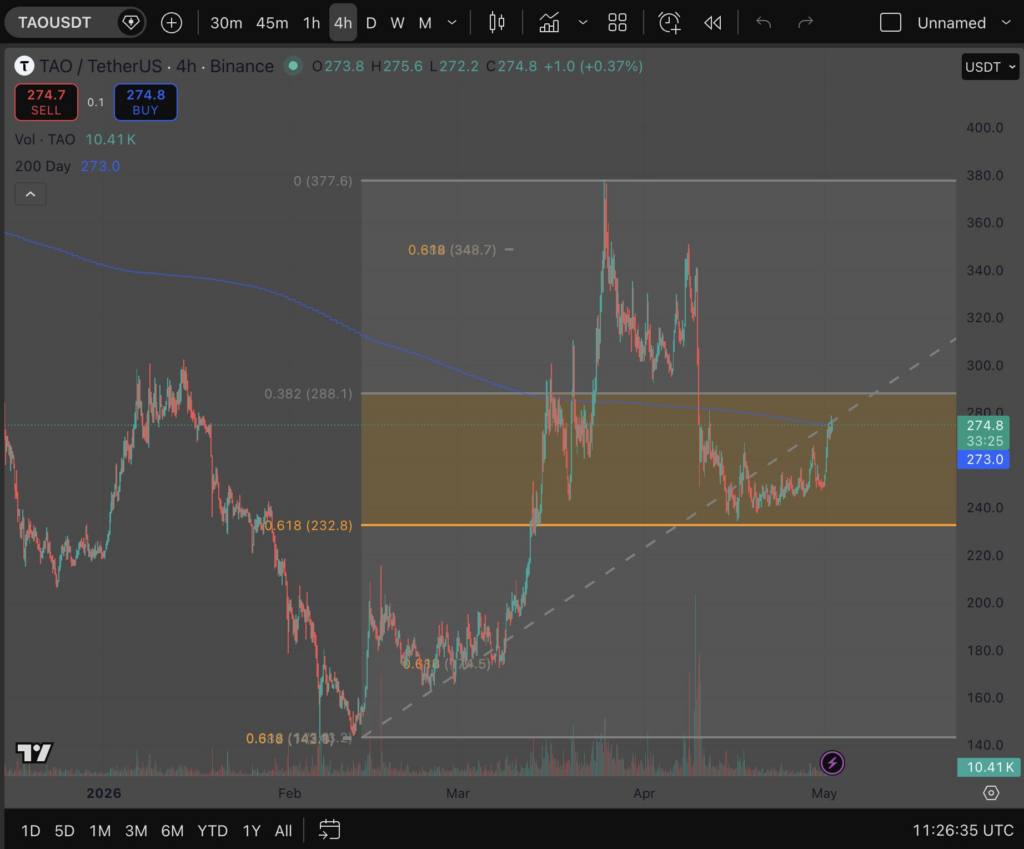
TAO recently moved above its 200-day moving average near $273 on the 4-hour timeframe. This level is often used to separate bullish and bearish trends. The move has drawn attention from traders tracking long-term structure.
Price had earlier dropped from $377 and found support near $232.8. This level aligns with the 0.618 Fibonacci retracement. Data shows repeated buying interest at this point. Market observers note that such levels often attract consistent demand.
Based on 2xnmore the 200-day MA is the line that separates bull market structure from bear market structure. The recent reclaim has placed TAO back above that line. However, price remains within a broader range, and no confirmed trend shift has been recorded.
TAO continues to trade between $232.8 and $288.1. This zone includes key Fibonacci levels and has acted as a consolidation range. The price action within this band suggests ongoing accumulation and resistance testing.
Resistance and Support Levels in Focus
However, the $288.1 level remains the nearest resistance. A move above this level may open a path toward $348.7, which marks another Fibonacci retracement point. This would represent a potential move of over 20% from current levels.
Traders are watching the weekly close closely. The analyst noted that the next candle that matters is the weekly close above $288. A confirmed break could signal stronger momentum, though current data shows price still below that mark.
On the downside, $232.8 remains a key support with a daily close below this level could shift focus toward the $174 region. This area previously acted as a base earlier in 2026 and may attract buyers again.Market activity shows TAO forming a rising wedge pattern on the 4-hour chart. This pattern often appears before a breakout or breakdown. The current structure places price near the upper boundary of this formation.