
In an ascent to the fourth-largest altcoin by market capitalization, Solana has showcased an impressive valuation, surpassing $90 billion. This week, it has seen a substantial increase of 38.70%, edging closer to the pivotal $250 mark.
Just in: Solana (SOL) has surged past $200, securing its position as the fourth-largest cryptocurrency globally by market capitalization. The latest milestone sees Solana surpassing Binance Coin (BNB) in market value. pic.twitter.com/Em5mwCqzIm
— TechTiynypen News (@TechTinypen) March 18, 2024
Experts are eyeing a potential bull run that could push its price beyond $250, with the weekly chart displaying a significant uptrend and momentum in SOL’s price.
Read Also: Crypto Markets: A Day of Contrasts with Notable Winners and Losers
Solana (SOL) Exhibits Bullish Trends
Solana’s price recovery signals a robust bullish momentum, with the possibility of challenging the 78.60% Fibonacci level, indicated by the third consecutive rising candlestick on the weekly chart. With an extraordinary growth of over 1000% in the past 180 days, Solana is poised for an impressive comeback story, according to cryptocurrency analysts.
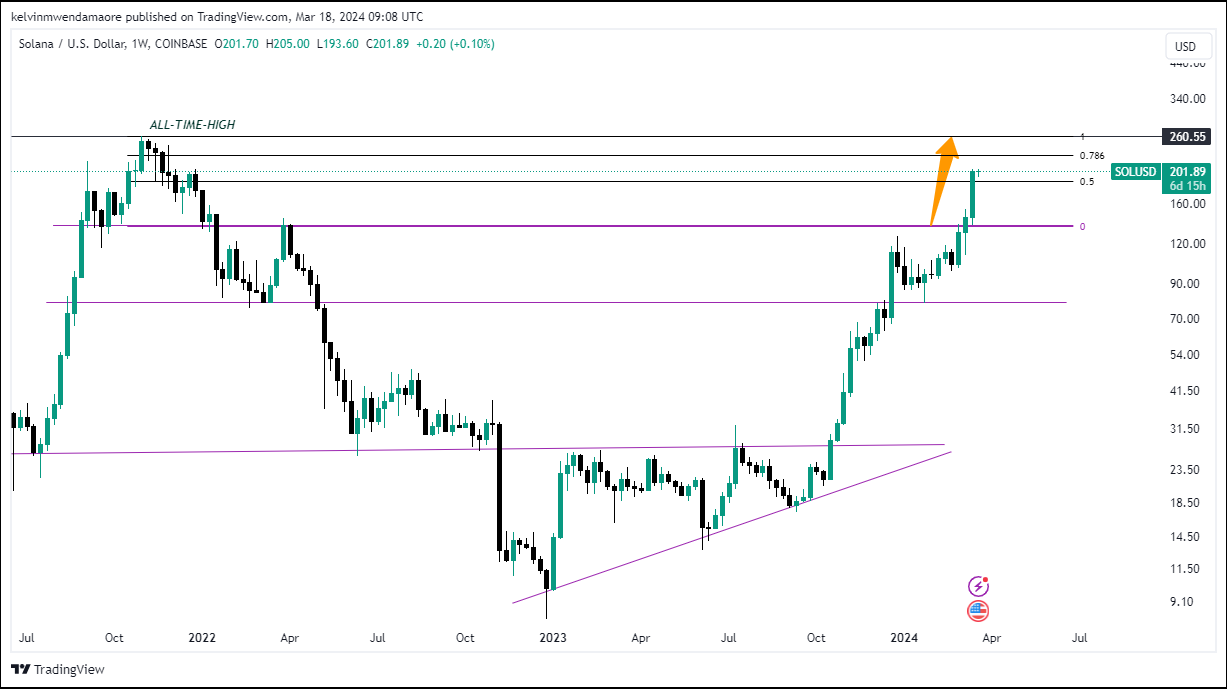 SOL/USDT 1-Week Chart (Source: TradingView)
Currently trading at $206.52, showing an 11.35% increase for the day, Solana’s trajectory suggests a continuous upward trend. If this momentum is sustained, prices could easily surpass the $250 threshold, potentially leading to a new all-time high. This resurgence is part of the broader market recovery, further bolstered by the altcoin’s recent demand surge.
Resistance levels for Solana now seem poised for an overhaul, with forecasts predicting a continuation of this upward trend into 2024. The altcoin’s swift rise to become the fourth-largest coin in just two days is a testament to its burgeoning popularity and investor confidence.
This bullish trend underlines the broader crypto market’s recovery, emphasizing the altcoin’s pivotal role in this resurgence. As Solana approaches the psychologically significant $250 mark, its market value’s potential to skyrocket is undeniable. Such a bullish outcome could redefine resistance levels, setting new benchmarks for the cryptocurrency.
SOL/USDT Technical Analysis
In the latest market analysis, Solana (SOL/USDT) demonstrates significant bullish momentum, signaling a potential move toward unprecedented highs. The 4-hour chart reveals that the Moving Average Convergence Divergence (MACD) indicator has climbed above the signal line, registering at 9.68. This key technical indicator suggests that SOL’s upward trend may persist in the short term.
Further bolstering this bullish outlook, the MACD histogram underscores increasing momentum by remaining above the zero line. This is a clear indicator of strong buying pressure, hinting at the possibility of continued price appreciation.
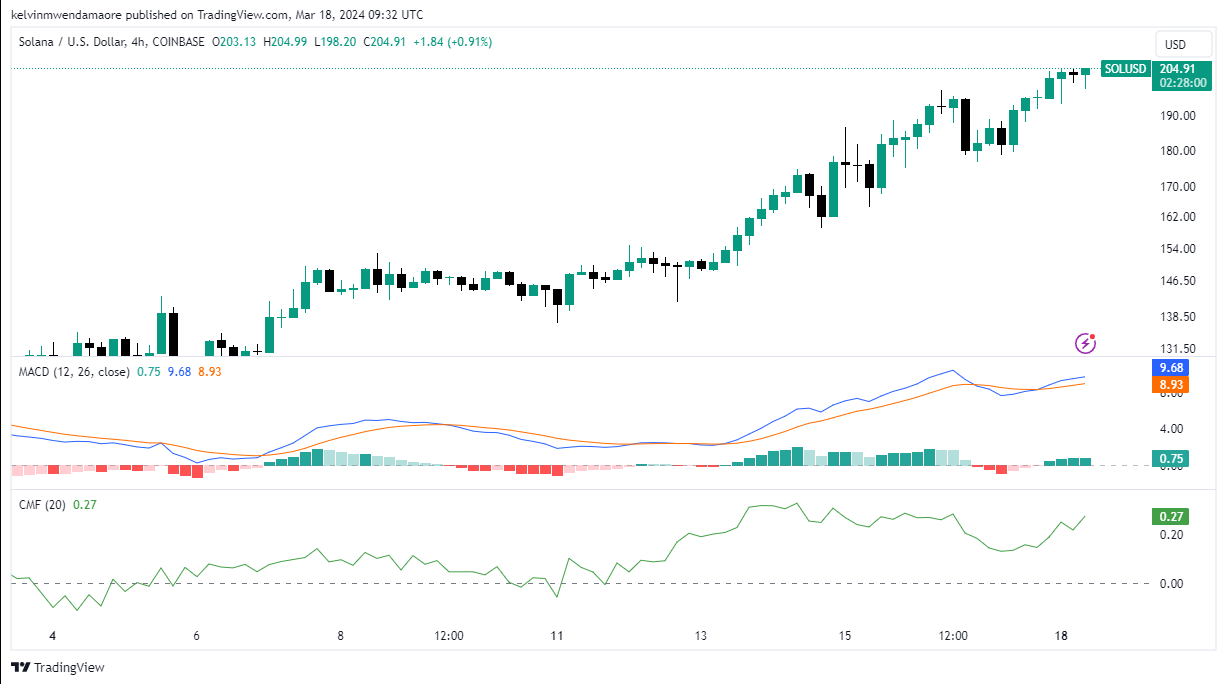 SOL/USDT 4-Hour Chart (Source: TradingView)
Complementing this optimistic scenario, the Chaikin Money Flow (CMF) indicator, currently at 0.27, reflects a robust influx of buying activity. Its upward trajectory confirms the market’s strong buying sentiment.
Together, these technical indicators point towards a sustained bullish phase for Solana, with the cryptocurrency potentially setting new all-time highs. Investors and traders are keenly observing these trends, suggesting an exciting period ahead for Solana’s market trajectory.