
As Bitcoin hovers around the $65K threshold, the cryptocurrency landscape is marked by intense volatility and speculative fervor. Amidst a broader market downturn and shifting investor sentiment, Bitcoin’s recent price movements reflect a complex interplay of technical indicators, market dynamics, and external pressures.
In a startling turn of events, Bitcoin’s price plummeted from $71,366 to $64,588 in less than two days, erasing nearly $7,000 from its value and triggering a massive wave of liquidations across the market. This dramatic downturn, which saw close to $700 million in positions wiped out between Monday and the early hours of the US session on Tuesday, marked a significant shift in market dynamics.
Also Read:Singapore Central Bank Expands Payment Services Act for Digital Token Oversight
The initial upward momentum that had characterized BTC’s recent trend vanished as sellers gained the upper hand, resulting in a 4.2% decline over the past 36 hours. On April 2nd alone, the market witnessed $62.2 million in long Bitcoin liquidations, signaling a notable change in the market’s direction.
This sell-off was further underscored by technical indicators that painted a bearish picture.The On-Balance Volume (OBV) metric, which had been trending downward throughout March, remained below a critical threshold, suggesting that selling pressure had dominated the market for several weeks.
With Bitcoin’s price teetering around the $64.5k level, which serves as short-term support, the landscape appeared primed for further losses, potentially driving the cryptocurrency to explore deeper liquidity pools to the downside.
Market Dynamics and Influential Factors
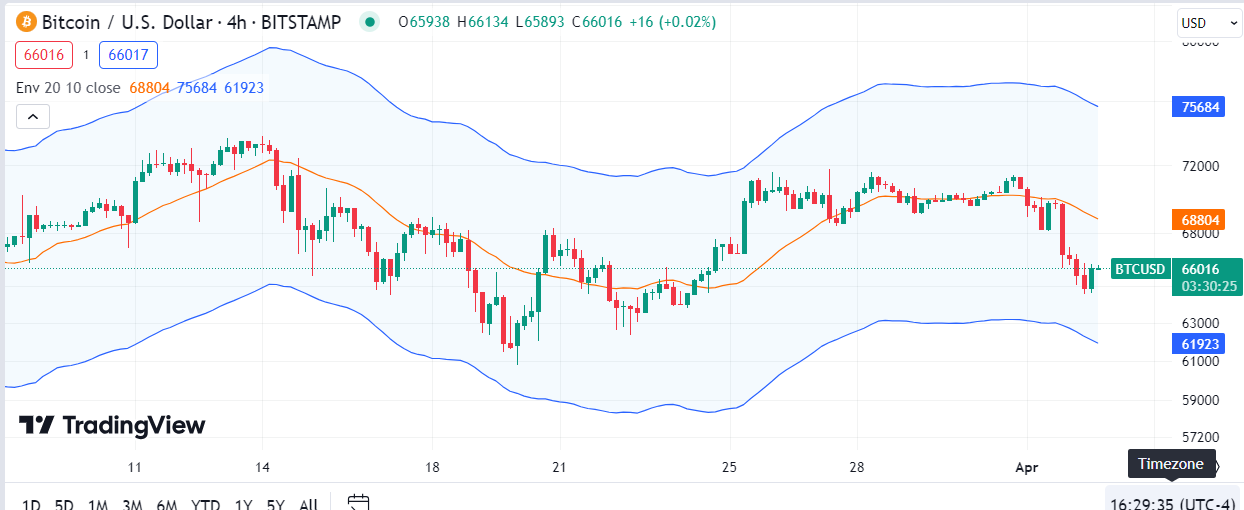
Bitcoin recently witnessed a downturn, dropping by 5% to briefly trade below the $66,000 threshold. It managed to recover slightly, stabilizing above $66,000, but the risk of closing below this critical level remains. Should this occur, Bitcoin could be forced to retest its support zones at $62,000 and $59,000, which previously held strong in March 2024. These levels are crucial for maintaining Bitcoin’s price stability in the face of market pressures.
As BTC hit $66K, significant liquidations took place.
In just four early morning hours, over $200M was lost by individuals engaged in leveraged trading. pic.twitter.com/b8luEL8osB
— Kyledoops (@kyledoops) April 2, 2024
The broader cryptocurrency market has also felt the impact, with major altcoins like Ether (ETH), Solana (SOL), Cardano (ADA), and Dogecoin (DOGE) registering over 8% declines within a 24-hour period. This market-wide retreat follows comments from CNBC’s Jim Cramer, who suggested that Bitcoin was extremely overbought. Although Cramer’s track record with crypto predictions is mixed, his statements have reignited discussions on Bitcoin’s valuation and market position.
Coming in the most overbought we've been in a while, .Better seller than buyer…
— Jim Cramer (@jimcramer) April 1, 2024
Grayscale’s Bitcoin Trust (GBTC) outflows have added to the downward pressure on Bitcoin’s price. On April 1, 2024, the ETF noted a significant outflow of BTC, exacerbated by high management fees, raising questions about investor sentiment and confidence in Bitcoin-focused funds.
According to SoSoValue, Bitcoin spot ETFs had a total net outflow of $85.84 million on April 1. Grayscale ETF GBTC had a single-day net outflow of $302 million, BlackRock ETF IBIT had net inflow of $165 million, Fidelity ETF FBTC had net inflow of $43.99 million, and the Bitcoin… pic.twitter.com/hCp6nk7T1Q
— Wu Blockchain (@WuBlockchain) April 2, 2024
Technical Outlook and Future Predictions
The technical analysis of Bitcoin presents a nuanced view. On the daily charts, the Relative Strength Index (RSI) stands at 35, indicating a neutral position. However, a closer examination of the four-hour charts shows an oversold condition with an RSI of 21, right before Bitcoin experienced a substantial price drop that triggered $200 million in liquidations.
In the derivatives market, Bitcoin has seen a substantial increase in trading volume, coupled with a slight decrease in open interest. This suggests a significant sell-off activity, further highlighted by the rapid liquidation of $163 million within a half-hour during a steep price drop. The spot market reveals a gap between buy orders and pending sell orders, partly attributed to GBTC outflows, underscoring the prevailing market uncertainty.
Despite these hurdles, Bitcoin has demonstrated resilience, bouncing back from lows but facing resistance at the $71,770 mark. This level is pivotal for Bitcoin’s immediate direction; breaching it could signal the start of a new uptrend towards $80,000, while failure may lead to profit booking by short-term traders, potentially driving the price to the 50-day SMA at $62,430.
Bitcoin Faces Turbulence Near $65K After the Recent Price Drop
Bitcoin’s recent price action has been nothing short of a rollercoaster, with the latest charts showing a sharp descent from the highs of $71,366 to a concerning low of $64,588. This near $7,000 crash in less than 48 hours not only sent shockwaves through the market but also led to the liquidation of nearly $700 million worth of positions, underscoring the high stakes in the cryptocurrency market.
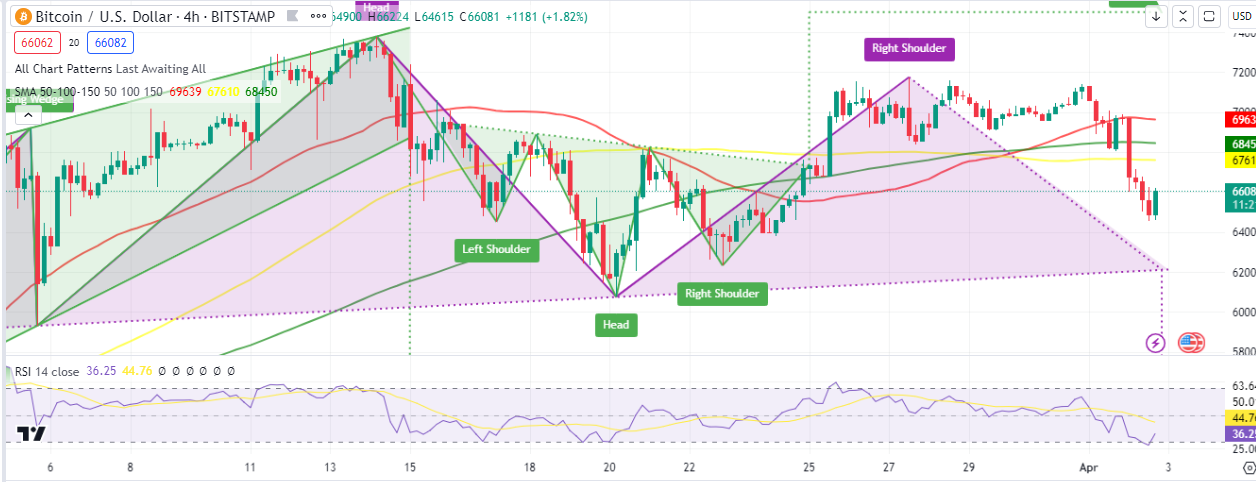
The chart indicates that the robust bullish momentum Bitcoin enjoyed has been replaced by dominant selling pressure. A look at the 4-hour timeframe reveals that the Relative Strength Index (RSI), a momentum indicator, has taken a steep dive below the midline, signaling a shift in momentum in favor of the bears. The head-and-shoulders pattern, often regarded as a bearish reversal pattern, has manifested, corroborating the sentiment that further downward movement could be on the horizon.
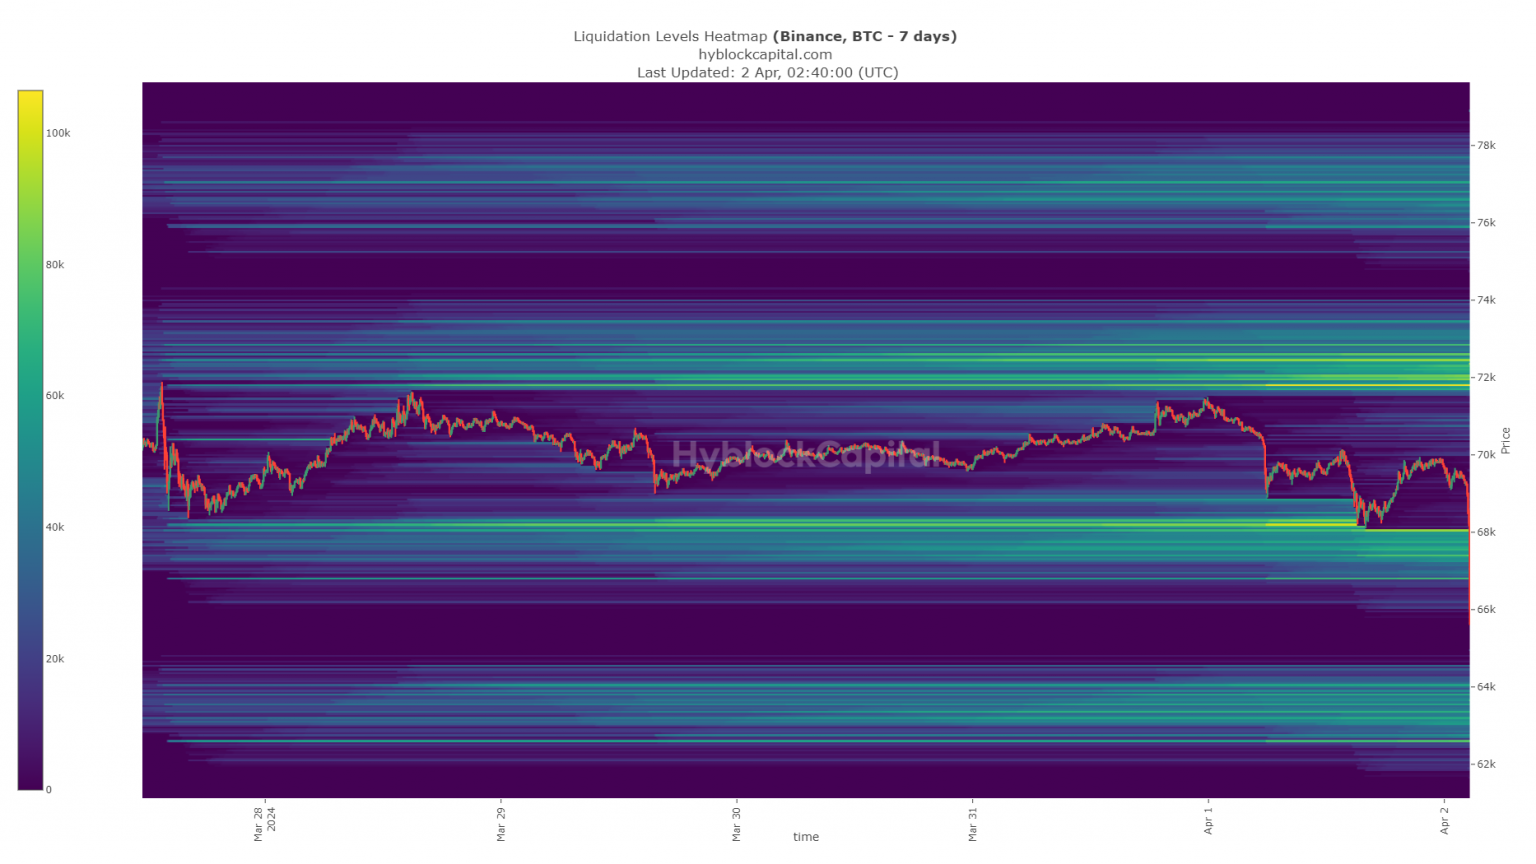
A critical point of focus for traders this week will be the $64.5k support level. This zone represents not only a psychological barrier but also a technical fulcrum point. Should Bitcoin fail to maintain this level, the door would be open for the price to seek the next liquidity pool, which could potentially be found at lower levels.
The wipe-out of the liquidation levels around $68k set off a liquidation cascade, pushing the price down to $66.4k. While the market may see a temporary bounce, possibly to catch out high-leveraged bears, a significant pool of liquidity awaits at $64k. Between $62.8k to $64k lies a concentrated zone of liquidation levels, and Bitcoin’s proximity to this band hints that we might see a sweep into this territory, preparing traders for the possibility of more losses.
Finally, the intense sell-off on April 2nd, which saw a 4.9% drop in just an hour, underlines the brittle nature of the current market structure. It is a stark reminder of the inherent volatility in the cryptocurrency markets and the rapid shifts in sentiment that can occur. Investors and traders will be watching closely to see if Bitcoin can reclaim and consolidate above the $64.5k support or if the cascade of liquidations will continue to drive the market lower.