Despite broader downturns, Solana (SOL) has surged to prominence today, outperforming its counterparts in the crypto market. The uptick in SOL’s price can be attributed to a unique confluence of factors, notably the unexpected influence of a meme coin craze and the realization of a technical breakout.
Today, SOL experienced a surge to $185, marking its highest level since January 2022. This surge stands out against a 0.25% decline across the broader crypto market. The rally in SOL’s price is underpinned by growing buying sentiment, signaling a distinct bullish sentiment within the cryptocurrency community.
Read also: Ether ETF Approval Odds Dip to 35% Amid SEC Silence, Analysts Say
Analyzing the daily price chart of SOL/USD reveals a robust bullish trend. The projections hint at a potential resurgence toward the $200 mark by the end of March. The current target range lies between $185 and $200, indicating a promising breakout from a bull flag structure, signaling further upward momentum for SOL.
SOL Charts Bullish Path Towards $200
On the 4-hour chart, SOL/USD showcases a pronounced upward trajectory, with the Keltner Channel bands suggesting likely resistance around $185.9. Although breaching the upper band implies sustained bullish sentiment, the Relative Strength Index (RSI) reading of 80.50 raises concerns about overbuying, heightening the risk of a market reversal or correction. Should such a scenario unfold, SOL might experience a pullback towards its 0.5 Fibonacci retracement level at $135, potentially marking a 20% decline from current levels.
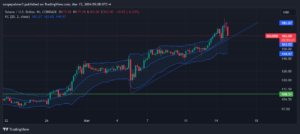
Key support levels for SOL include $150, $140, and $130, with a significant bullish trend line forming at $132 on the weekly chart. A breach below the $130 support level could trigger notable bearish movements. This could potentially lead to a revisit of the $100 mark.
While SOL faces hurdles near the $185 resistance, coinciding with the 61.8% Fib retracement level, clearing this barrier could instigate another bullish rally. In such a scenario, the next targets for bullish momentum are $185 and potentially $200. Conversely, a failure to sustain momentum above the $185 resistance may initiate a downside correction, with immediate support levels at $150 and $140, while the main support zone forms around $130. A weekly close below $130 could amplify bearish pressure, possibly directing SOL towards the $100 level.
Despite prevailing market volatility and overbought conditions, Solana (SOL) retains a promising outlook for further upside potential, supported by recent price performance and technical indicators.
Solana (SOL) Faces Sell Signal from TD Sequential Indicator
The TD Sequential indicator on the daily chart for Solana (SOL) has presented a sell signal. This indicates a potential reversal in the cryptocurrency’s recent bullish trend. Historically, whenever this indicator has signaled a sell since December 2023, SOL’s price has experienced notable retracements ranging from 17% to 28%.
The TD Sequential presents a sell signal on the #Solana daily chart!
Since December 2023, every time this indicator suggested selling, the price of $SOL dropped by 17% to 28%. A similar outlook could see #SOL retrace to $152 or even $127. pic.twitter.com/3JbXdabK3v
— Ali (@ali_charts) March 14, 2024
Considering this pattern, analysts suggest that SOL could retrace to levels around $152 or even $127 in the near term. This prediction aligns with the current correction observed on the hourly chart, reflecting the insights of market analyst Ali Martinez.
At press time, Solana’s price stands at $172.33, with a 24-hour trading volume of $12,069,901,856, according to CoinMarketCap data reflecting a slight decrease of 1.10% in the last 24 hours. However, SOL still maintains its position as the 5th largest cryptocurrency by market capitalization, with a live market cap of $74,241,409,317.
Editorial credit: rafapress / Shutterstock.com