Key Insights:
- Stellar Realized Cap Impulse rose toward zero after reaching minus twenty-one in Q4.
- XLM remained stable between $0.10 and $0.13 during the metric’s recovery phase.
- Previous centerline recoveries in 2017, 2019, and 2020 preceded strong XLM price advances.
- Stellar supports MoneyGram corridors, USDC issuance, Franklin Templeton products, and CBDC pilots.
Stellar (XLM) is drawing attention after a little-known on-chain metric moved higher following one of its weakest readings in recent years. Stellar Realized Cap Impulse (Long-Term) reached a deep negative level in the fourth quarter of 2025 before starting a recovery. The change comes as XLM trades between $0.10 and $0.13 and market participants monitor signs of renewed capital activity.
The metric measures long-term capital flows into Stellar and filters out short-term trading activity. The firm stated that the indicator reached -21 during Q4 2025. That marked the second-lowest reading since 2019. The only lower level occurred during the market decline in March 2020.
Stellar Realized Cap Impulse Shows Recovery
Alphractal reported that the Realized Cap Impulse has moved back toward the zero line after the Q4 2025 decline. The firm said the metric reflects changes in the cost basis of long-term holders rather than short-term market sentiment. As a result, it is used to track capital movement over extended periods.
The company noted that the shift from deep negative territory may indicate that long-term selling pressure has slowed. It also stated that capital absorption appears to be increasing as the metric improves. The recovery has taken place while XLM has remained within a relatively stable price range.
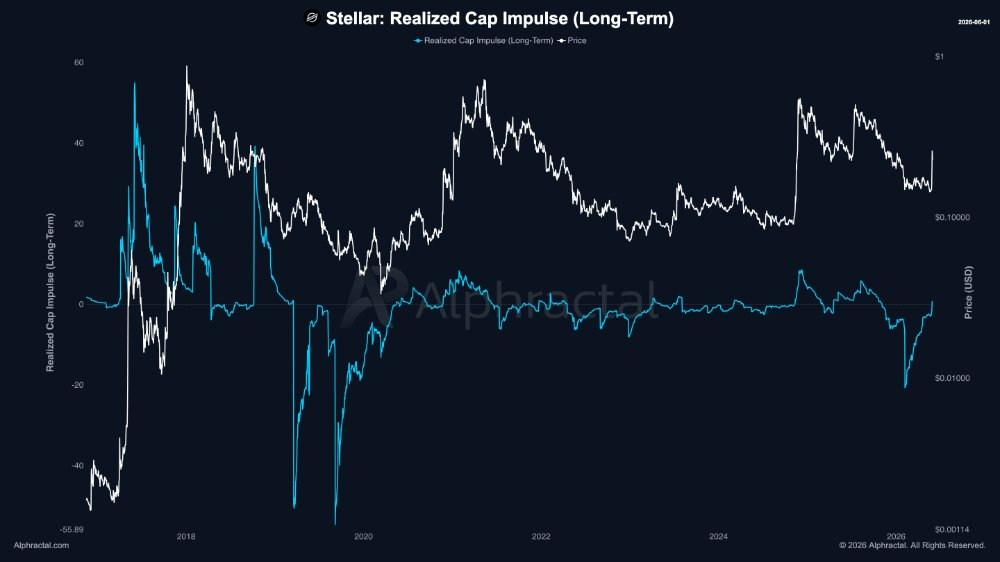
Alphractal described the recent movement as a change in long-duration holder behavior. The firm stated, “Realized Cap Impulse going from -21 to ~0 is mechanical proof that long-duration capital has stopped exiting and started absorbing.”
The metric differs from traditional trading indicators because it focuses on realized capitalization data. This approach tracks the value of coins based on their last on-chain movement rather than current market prices.
Historical Trends and Network Activity
Alphractal compared the current setup with previous market cycles. The firm said that each time the metric crossed above its centerline after a deep negative reading, XLM later recorded gains of more than two times within nine months. Those cases occurred in 2017, 2019, and 2020.
The company emphasized that the historical sample remains limited. All three previous examples followed a similar pattern. Market participants often review such data to identify recurring trends in asset behavior.
Beyond on-chain metrics, Stellar continues to support several financial initiatives. Alphractal pointed to MoneyGram remittance services, native USDC issuance, and blockchain projects linked to Franklin Templeton. The network has also participated in multiple central bank digital currency pilot programs.
He stated that the latest reading suggests a period of stabilization after heavy selling during late 2025. Added that long-term capital activity will remain an area of focus as traders monitor future price performance.