
Bitcoin BTC price continues to hover around $65,000, showing a notable steadiness against market volatility with a recent slight increase to $64,094. This stability, along with technical indicators pointing to bullish sentiment, suggests that Bitcoin may be poised for a breakout. Investors are closely watching the $64,000 support and $69,000 resistance levels for signs of the next significant price movement.
Bitcoin’s price trajectory today has been relatively stable, with the cryptocurrency gaining a slight 0.36% to close at $64,094. The modest uplift is attributed in part to the declining outflows from the Grayscale Bitcoin Trust, which suggests a more balanced supply-demand equation in the market. Despite the overall market’s volatility, Bitcoin’s resilience is evident as it manages to maintain a steady price level.
BTC Shows Stability and Bullish Signals on Daily Chart
On the daily chart, Bitcoin’s maintenance above the 50-day and 200-day EMAs is a bullish signal. A rebound back to the $65,000 mark could be an indication of bullish sentiment, potentially leading to a test of the $69,000 resistance. A break beyond this resistance may set the stage for a rally toward the all-time high of $73,808. It’s crucial to note the 14-day Relative Strength Index (RSI) reading of 50.10, which points to neutral market momentum, neither overbought nor oversold.
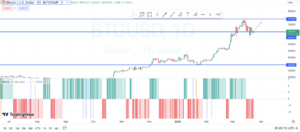
The candlestick formations on the daily chart show a compression of volatility with a series of smaller body candles, which often precede a significant breakout. The price action is delicately poised at a junction where a definitive move above the immediate resistance level near $65,000 could see Bitcoin challenge the next resistance level at $69,000.
A breach of this level might signal a strong market conviction to revisit the all-time high near $73,808. Conversely, a close below the 50-day EMA could dampen the bullish narrative, bringing the first major support level into play at around $60,365.
BTC 4-Hour Chart Analysis: Decisive Movements on the Horizon
The 4-hour chart offers a closer look at Bitcoin’s recent price action, revealing a pattern of consolidation within a descending channel. This pattern points to an ongoing tussle between bears and bulls, with the outcome dependent on a decisive breakout or breakdown from the current price range. The immediate support at the $64,000 threshold is critical, as a drop below this level may result in a slide towards second support at $60,365, marking a significant retracement from current levels.
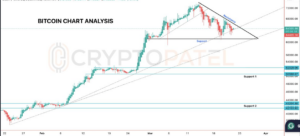
The current support level at $64,000 is the key level to watch for the bulls; holding this ground is essential to avoid a bearish downturn. A sustained break below this could exert additional selling pressure, targeting the subsequent support level mentioned previously. The 4-hour RSI provides a granular view of the momentum, which has been relatively flat, hinting at the indecision and the potential for a sharp move once the market picks a direction.
Influence of ETFs on Bitcoin’s Price
The Bitcoin ETF market is a vital component of the cryptocurrency’s price dynamics. The net inflows and outflows within these funds can provide insights into institutional and savvy investor behavior. The recent downturn in GBTC outflows, despite a week of significant outflows, presents a complex picture. While some investors may be taking a step back, others remain committed to their Bitcoin positions.
Looking ahead, Bitcoin’s price movement will likely continue to be influenced by a mix of technical indicators, market sentiment, and the broader financial environment. The cryptocurrency’s ability to stay above key support levels suggests underlying strength, yet investors should be prepared for volatility, particularly in response to high-impact economic events and regulatory news.
Bitcoin’s current market position is cautiously optimistic, with potential for both upward and downward movements. The key will be to monitor the cryptocurrency’s response to upcoming market signals and technical thresholds. Investors should watch for a potential push toward $69,000, which could open the path to new highs or a dip below current support levels, which might signal a bearish downturn.
Read Also: Grayscale Faces Further Delay from SEC on Ether Futures ETF
The Bitcoin Exchange-Traded Fund (ETF) market is signaling a nuanced picture for Bitcoin’s price dynamics, with recent trends showing a reduction in outflows from the Grayscale Bitcoin Trust. This shift may indicate a balanced demand for Bitcoin among institutional investors despite a week of substantial outflows. The activity within these funds, reflecting both retreats and commitments, is expected to continue to play a critical role in shaping Bitcoin’s valuation as the market anticipates further economic and regulatory developments.